
ISPRI Quantify™
Streamline R&D with actionable immunogenicity data.
Now offering a solution designed for monoclonal antibody developers seeking an even easier and faster immunogenicity risk assessment to characterize lead candidates! ISPRI Quantify™ provides a profile of immunogenic risk for a lead candidate with results that can guide your R&D strategy, allowing you to save time and money on downstream in vitro and in vivo immunogenicity studies.
With this “just the facts” analysis, you’ll receive a rapid, precise, and holistic immunogenicity overview. The assessment compiles what EpiVax experts consider to be the most critical scores available from our in silico toolkit to enable an accurate prediction of immunogenic potential, including details on sequence-level T cell epitope and “humanness” scoring. These scores are ranked against mAbs of known immunogenicity for easy benchmarking (Figure 1), a high-level “T cell epitope content breakdown” (Figure 2) is provided, as well as T cell epitope maps to give regional immunogenicity insights (Figure 3) to classify the number of regulatory, potentially tolerated, and foreign epitopes in your sequence (key considerations for the most accurate risk assessment).
ISPRI Quantify™ will empower you to navigate the complexities of immunogenicity risk swiftly and confidently.
What can ISPRI Quantify™ do for you?
-
Provide immunogenicity data to include in:
-
Internal product characterization / R&D strategy discussions
-
Fundraising materials
-
Publications
-
Research grant applications
-
-
Determine the overall and regional immunogenic potential of your lead candidate(s).
-
Direct R&D strategies by reducing volume of downstream in vitro and in vivo immunogenicity studies, saving precious resources (typically 20-fold).
-
Gain insights on potential sequence optimization needs.
Paired Analysis & ADA Prediction
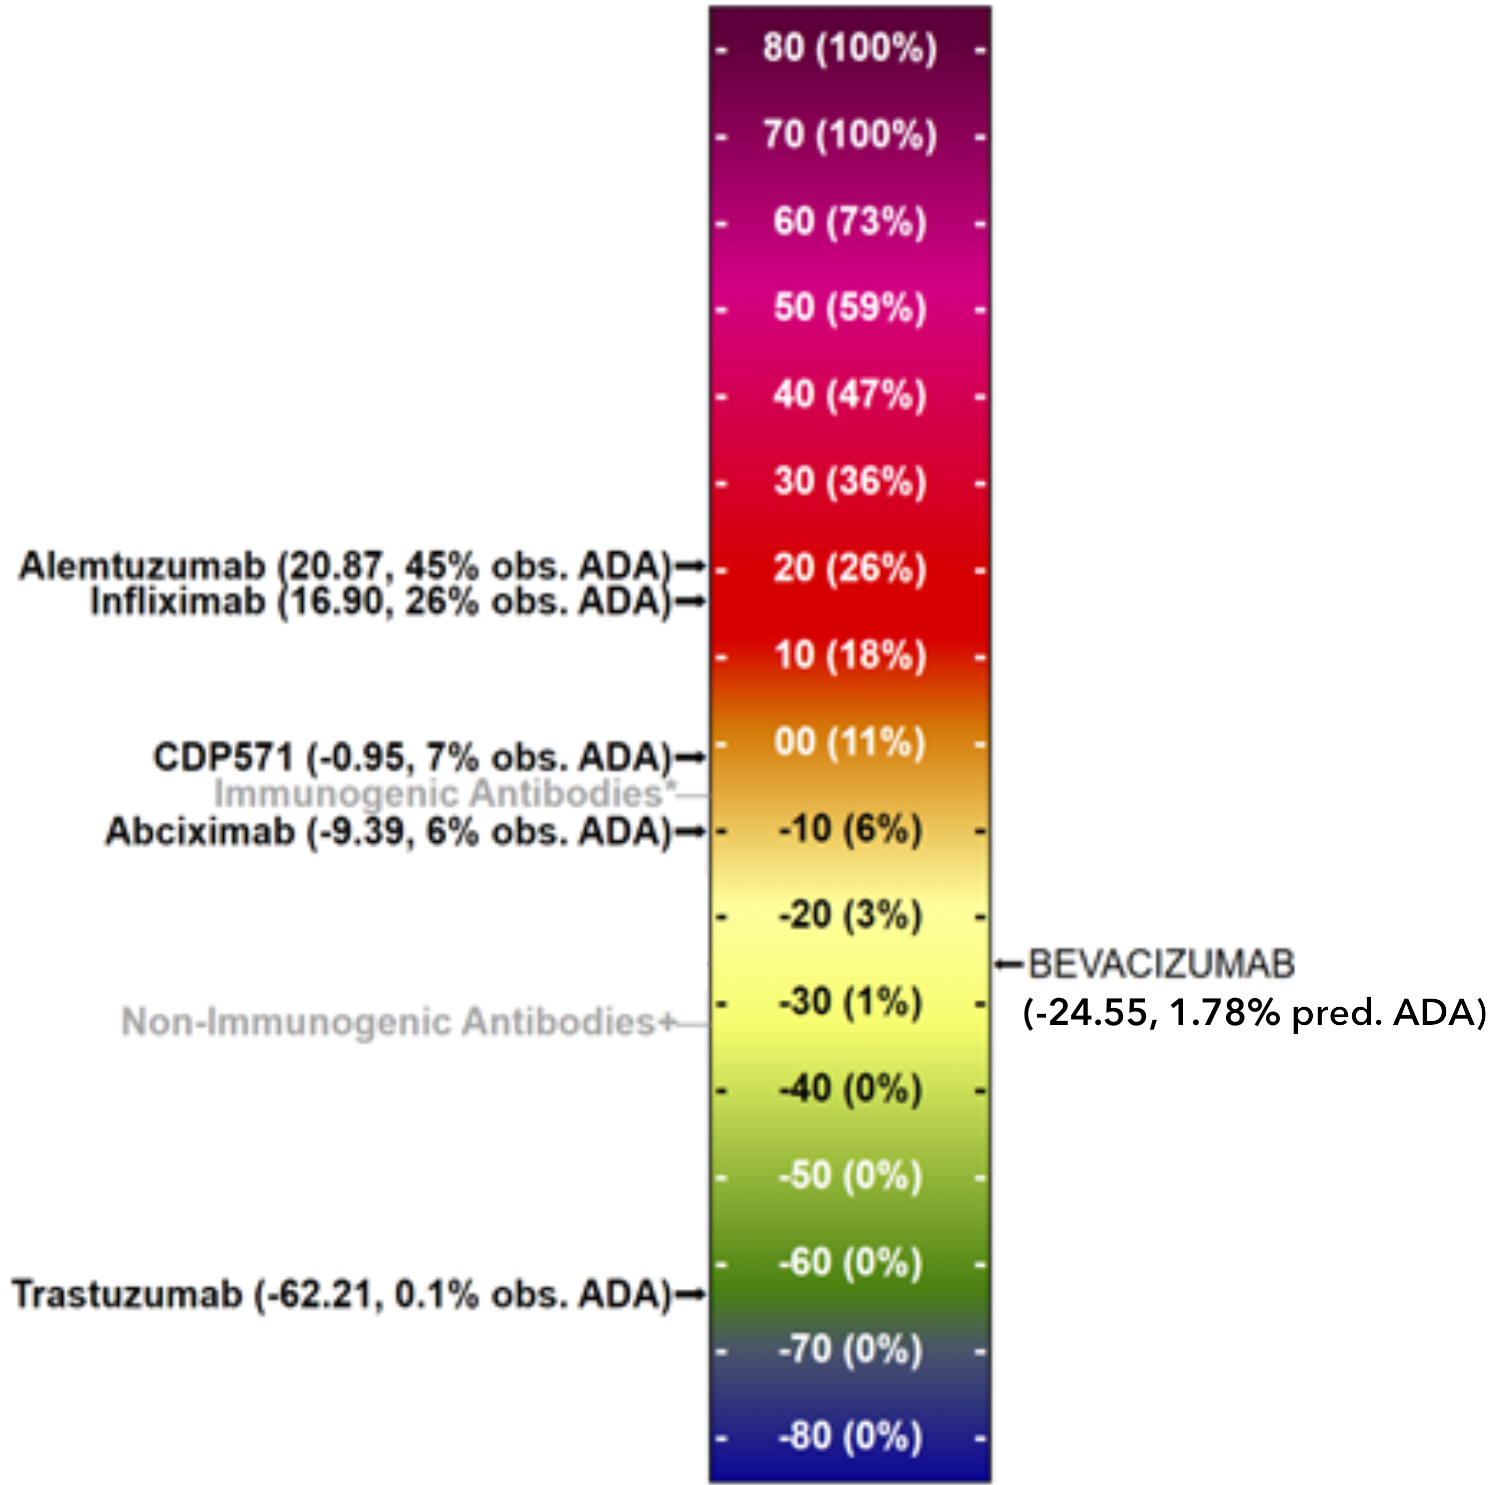
Figure 1
Epitope Content Breakdown
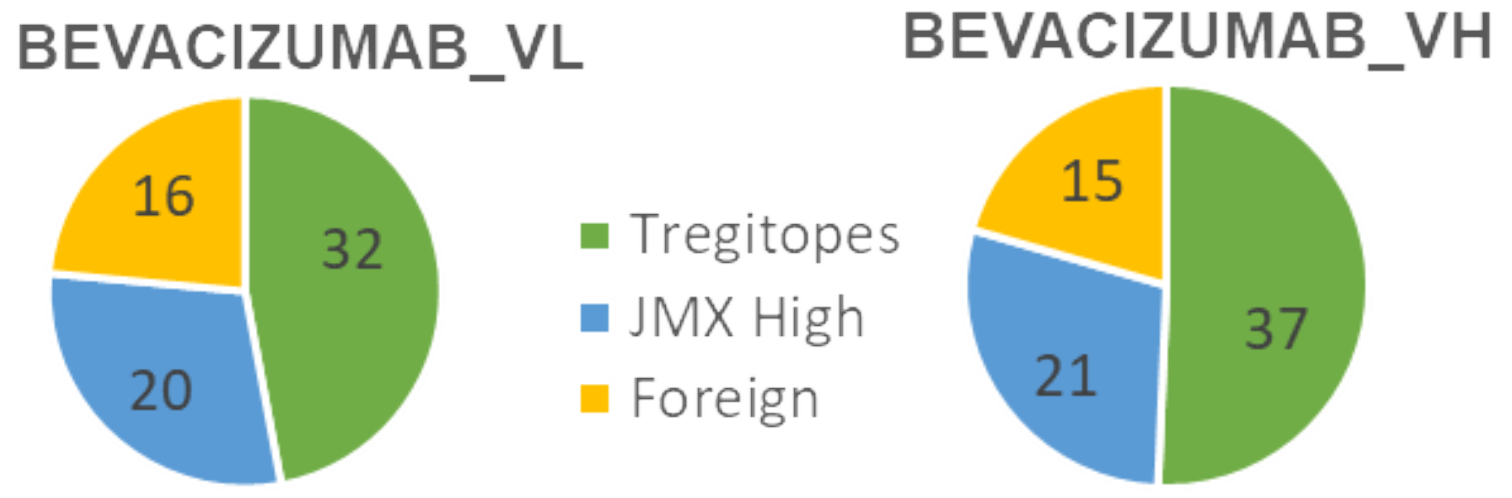
Figure 2
Conclusions
The Tregitope-adjusted EpiMatrix Score of BEVACIZUMAB VL (-18.75) falls in the neutral-low range on our scale. The Tregitope-adjusted EpiMatrix Score of BEVACIZUMAB VH domain (-29.55) falls in the neutral-low range on our scale. The paired VH/VL Tregitope-adjusted EpiMatrix Score (-24.55) falls in the neutral-low range on our scale, suggesting low potential for driving anti-therapeutic immune response.
Our regression model predicts that BEVACIZUMAB will induce anti-therapeutic immune response in approximately 1.78% of exposed subjects.
Epitope Maps
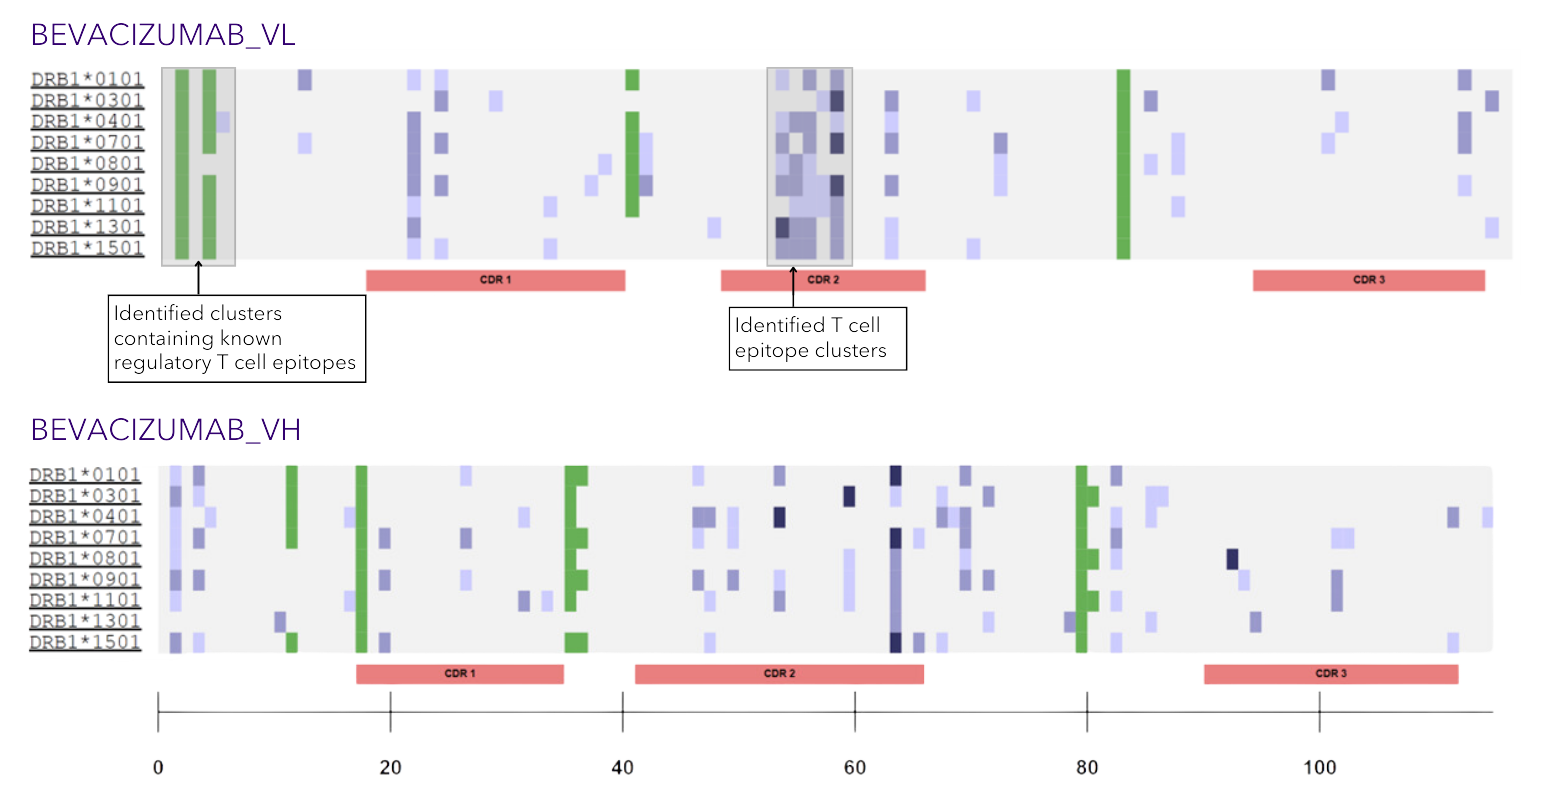
Figure 3
Need actionable immunogenicity data?
Learn more about ISPRI Quantify™!
Need a more comprehensive immunogenicity report? Check out ISPRI Evaluate!
